Testbeam-2004 Analysis
Introduction:
This group includes:
Neil Knecht, Peter Krieger, Lianliang Ma and Pekka K. Sinervo.
the data sample and the Monte Carlo (MC) simulation, more information about our work
can be found with the reports listed below.
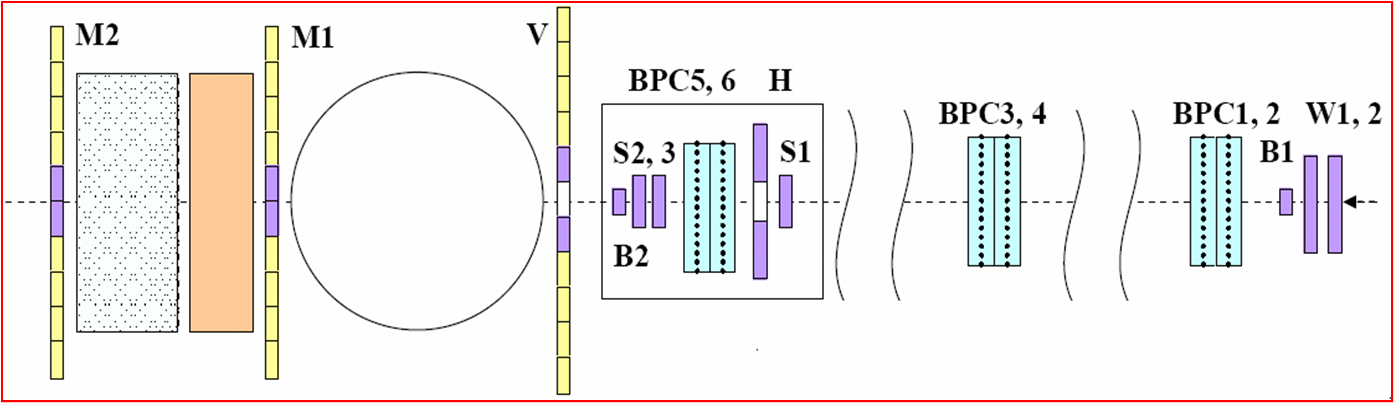
The top view of the setup for testbeam 2004 is shown in the below plot.
The calorimeter is located in the open circle, and consists of: ElectroMagnetic
calorimeter at EndCap (EMEC), Forward Calorimeter (FCal) and Hadronic Calorimeter at EndCap (HEC).
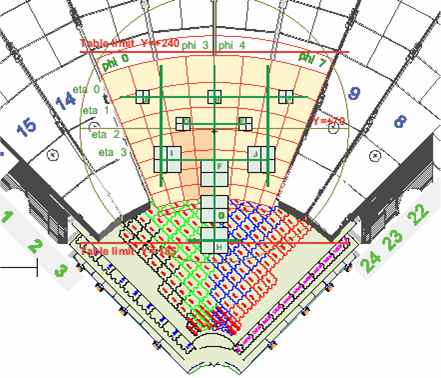
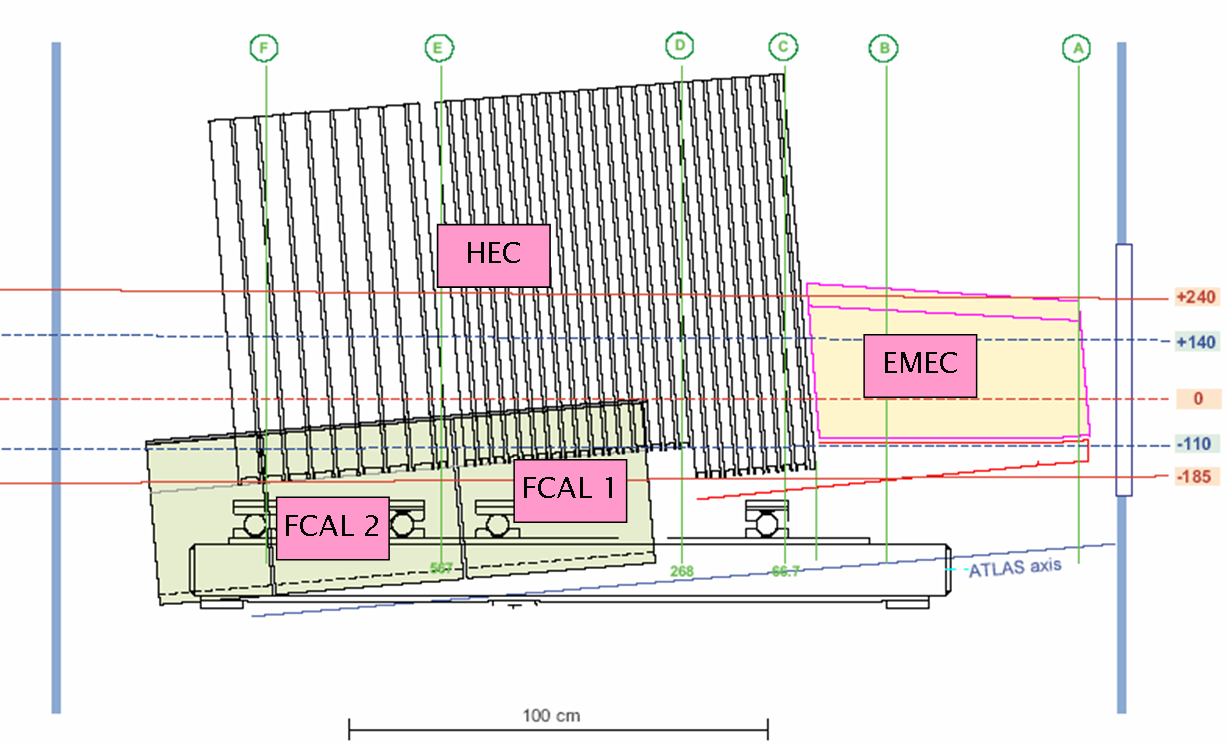
The front-view and side-view of the H6 setup are also shown as below.
The data was collected during two run phases: RunI and RunII, with beam particle electron,
pion and muon. In the Frontveiw plot, the vertical green line means where y-scan data is
collected, the horizontal green line for x-scan, and A-H points for e(nergy)-scan.
More information about the testbeam data can be found
here.
You can also visit the web for the information collected by Neil
(Click here).
|
With this testbeam data, we can study: |
Top view of the CBT-EC2 setup |
|
Front view of H6 setup (run II) |
Side view of H6 setup (run II) |
Reports:
Now we are focusing on the beam-tracking algorithm, and S-shape of EMEC, more
detailed information can be available in the reports presented recently:
Slides from Neil:
here.
Slides from Lianliang :
here.
Other Useful links:
Document on Combined Test Beam at CERN
Last update on May 11, 2007. If you have any
questions/comments about our study or this web page, please send an email to the webmaster.